sncosmo.plot_lc
- sncosmo.plot_lc(data=None, model=None, bands=None, zp=25.0, zpsys='ab', pulls=True, xfigsize=None, yfigsize=None, figtext=None, model_label=None, errors=None, ncol=2, figtextsize=1.0, show_model_params=True, tighten_ylim=False, color=None, cmap=None, cmap_lims=(3000.0, 10000.0), fill_data_marker=None, fname=None, fill_percentiles=None, **kwargs)[source]
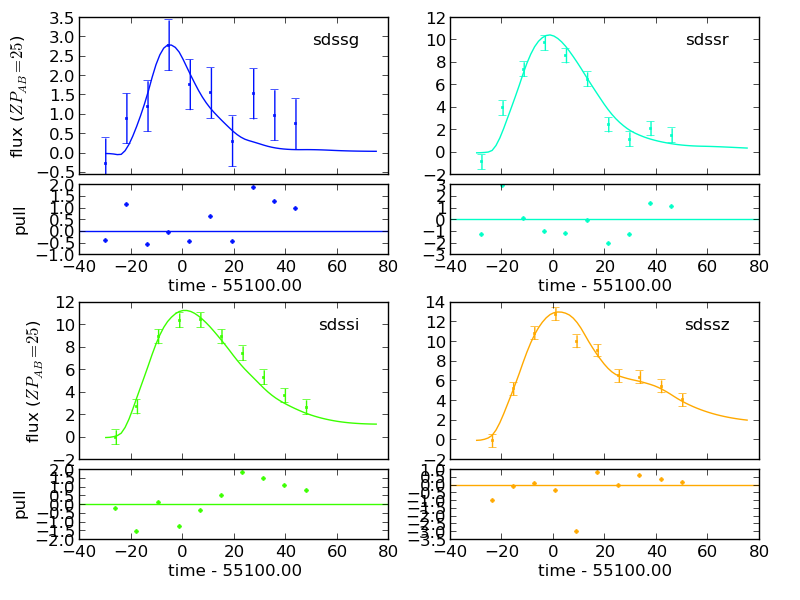
Plot light curve data or model light curves.
- Parameters:
- dataastropy
Tableor similar, optional Table of photometric data. Must include certain column names. See the “Photometric Data” section of the documentation for required columns.
- model
Modelor list thereof, optional If given, model light curve is plotted. If a string, the corresponding model is fetched from the registry. If a list or tuple of
Model, multiple models are plotted.- model_labelstr or list, optional
If given, model(s) will be labeled in a legend in the upper left subplot. Must be same length as model.
- errorsdict, optional
Uncertainty on model parameters. If given, along with exactly one model, uncertainty will be displayed with model parameters at the top of the figure.
- bandslist, optional
List of Bandpasses, or names thereof, to plot.
- zpfloat, optional
Zeropoint to normalize the flux in the plot (for the purpose of plotting all observations on a common flux scale). Default is 25.
- zpsysstr, optional
Zeropoint system to normalize the flux in the plot (for the purpose of plotting all observations on a common flux scale). Default is
'ab'.- pullsbool, optional
If True (and if model and data are given), plot pulls. Pulls are the deviation of the data from the model divided by the data uncertainty. Default is
True.- figtextstr, optional
Text to add to top of figure. If a list of strings, each item is placed in a separate “column”. Use newline separators for multiple lines.
- ncolint, optional
Number of columns of axes. Default is 2.
- xfigsize, yfigsizefloat, optional
figure size in inches in x or y. Specify one or the other, not both. Default is to set axes panel size to 3.0 x 2.25 inches.
- figtextsizefloat, optional
Space to reserve at top of figure for figtext (if not None). Default is 1 inch.
- show_model_paramsbool, optional
If there is exactly one model plotted, the parameters of the model are added to
figtextby default (as two additional columns) so that they are printed at the top of the figure. Set this to False to disable this behavior.- tighten_ylimbool, optional
If true, tighten the y limits so that the model is visible (if any models are plotted).
- colorstr or mpl_color, optional
Color of data and model lines in each band. Can be any type of color that matplotlib understands. If None (default) a colormap will be used to choose a color for each band according to its central wavelength.
- cmapColormap, optional
A matplotlib colormap to use, if color is None. If both color and cmap are None, a default colormap will be used.
- cmap_lims(float, float), optional
The wavelength limits for the colormap, in Angstroms. Default is (3000., 10000.), meaning that a bandpass with a central wavelength of 3000 Angstroms will be assigned a color at the low end of the colormap and a bandpass with a central wavelength of 10000 will be assigned a color at the high end of the colormap.
- fill_data_markerarray_like, optional
Array of booleans indicating whether to plot a filled or unfilled marker for each data point. Default is all filled markers.
- fnamestr, optional
Filename to pass to savefig. If None (default), figure is returned.
- fill_percentiles(float, float, float), optional
When multiple models are given, the percentiles for a light curve confidence interval. The upper and lower perceniles define a fill between region, and the middle percentile defines a line that will be plotted over the fill between region.
- kwargsoptional
Any additional keyword args are passed to
savefig. Popular options includedpi,format,transparent. See matplotlib docs for full list.
- dataastropy
- Returns:
- figmatplotlib
Figure Only returned if
fnameisNone. Display to screen withplt.show()or save withfig.savefig(filename). When creating many figures, be sure to close withplt.close(fig).
- figmatplotlib
Examples
>>> import sncosmo
>>> import matplotlib.pyplot as plt
Load some example data:
>>> data = sncosmo.load_example_data()
Plot the data, displaying to the screen:
>>> fig = plot_lc(data)
>>> plt.show()
Plot a model along with the data:
>>> model = sncosmo.Model('salt2')
>>> model.set(z=0.5, c=0.2, t0=55100., x0=1.547e-5)
>>> sncosmo.plot_lc(data, model=model)
Plot just the model, for selected bands:
>>> sncosmo.plot_lc(model=model,
...                 bands=['sdssg', 'sdssr'])
Plot figures on a multipage pdf:
>>> from matplotlib.backends.backend_pdf import PdfPages
>>> pp = PdfPages('output.pdf')
>>> # Do the following as many times as you like:
>>> sncosmo.plot_lc(data, fname=pp, format='pdf')
>>> # Don't forget to close at the end:
>>> pp.close()